Endpoint Catalog enables you to review and manage your endpoint inventory. The Endpoint Catalog includes various views and reports providing detailed and various endpoint related counts. This allows you to efficiently monitor endpoints in high scale deployments.
From the Endpoint Catalog, you can view details that provide information about the endpoint, component, software modules, operating system and logs.
Accessing the Endpoint Catalog
-
From Proofpoint Data Security, select the Administration application. Select Endpoints > Endpoint Catalog.
-
Select the view you want:
-
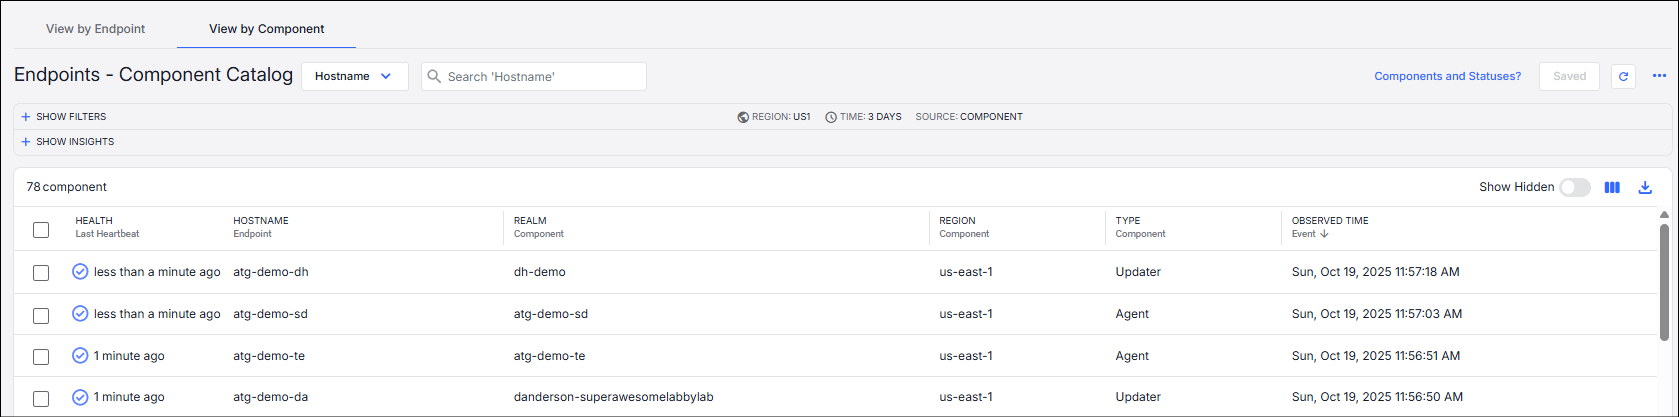
View by Component: The clients installed on the endpoint. This can be the Agent or the Updater. The Component view shows the health status (Last Heartbeat).
-
View by Endpoint: The actual physical/machines.
Available Fields
Available fields include:
-
Components (available for Component view only): Such as Type, Realm, Region, Status Code
-
Endpoint: Such as Hostname, Alias, OS Type
-
Record: Such as Sort Key, Type, Retain Until
-
Event: Such as Created Time, Observed Time, Time Local Data
This table describes some of the common fields. (Other fields are available and some new fields may be added in the future.)
View by Endpoint
| Field | Description |
|---|---|
| Endpoint | |
| Alias | |
| Alias Value | |
| Directory Domain | Active Directory Domain within a Microsoft Active Directory Network. For example, you can explore all activities by endpoints of a Directory Domain such as PFPTDEV. |
| Directory Organizational Unit | An Organizational Unit (OU) with an Active Directory that contains users, groups, and more. For example, you can explore all activities of an OU such as PROOFPOINT-SYS. |
| Hostname | Hostname of endpoint on which the Proofpoint Agent is installed and is monitoring. |
| City Code | City code where endpoint is located. |
| Country Code | Country code where endpoint is located. |
| Location IP | |
| Name | Name of endpoint on which the Proofpoint Agent is installed and is monitoring. |
| Network Interface IP | Network interface IP of the endpoint, such as IPv4. |
| OS Type | Operating system, Windows or Mac OS.) |
| OS Name | OS name, such as Big Sur, Microsoft Window 10 pro. You can use the operators to broaden the filter. |
| Software Modules Type | Modules installed on the Endpoint, includes the Components such as Agent/Updater and also Bundle or other future modules like Content scanning. |
| Software Modules Realm | |
| Software Modules Region | |
| Software Modules State Update |
Completed Time Started Time Status Causes Code Status Code |
| Tenant | |
| Record | |
| Important Fields Hash | |
| Type | |
View by Component
View by Component includes the fields described below and the Endpoint fields described above.
The following fields are available in the View by Endpoint view.
| Field | Description |
|---|---|
| Endpoint | |
| Alias | |
| Alias Value | |
| Directory Domain | Active Directory Domain within a Microsoft Active Directory Network. For example, you can explore all activities by endpoints of a Directory Domain such as PFPTDEV. |
| Directory Organizational Unit | An Organizational Unit (OU) with an Active Directory that contains users, groups, and more. For example, you can explore all activities of an OU such as PROOFPOINT-SYS. |
| Hostname | Hostname of endpoint on which the Proofpoint Agent is installed and is monitoring. |
| City Code | City code where endpoint is located. |
| Country Code | Country code where endpoint is located. |
| Location IP | |
| Name | Name of endpoint on which the Proofpoint Agent is installed and is monitoring. |
| Network Interface IP | Network interface IP of the endpoint, such as IPv4. |
| OS Type | Operating system, Windows or Mac OS.) |
| OS Name | OS name, such as Big Sur, Microsoft Window 10 pro. You can use the operators to broaden the filter. |
| Software Modules Type | Modules installed on the Endpoint, includes the Components such as Agent/Updater and also Bundle or other future modules like Content scanning. |
| Software Modules Realm | |
| Software Modules Region | |
| Software Modules State Update |
Completed Time Started Time Status Causes Code Status Code |
| Tenant | |
| Record | |
| Important Fields Hash | |
| Type | |
| Component | |
| Health | Last hearbeat |
| Hostname | Endpoint hostname |
| Type | Type of component, Agent or Updater |
| Realm | Name of Agent Realm |
| Region | Region of Agent Realm |
| Tenant | Name of the tenant the endpoint belongs to. |
| Status Code |
Status of the component, such as healthy, registered, unregistered, etc. |
| Control Status | Indicates which capabilities Registered or Unregistered components can perform. This can be updated by the Administrator from Endpoint Catalog |
| Tenant | ID for component's tenant. |
| Status Causes Visibility | Show/hide the component in the grid. |
| Event | |
| Created Time | Time the Component or Endpoint record was created |
| Type | Type of event. For an Endpoint, it's "it:catalog:endpoint:event" and for a Component it's "it:catalog:component:event". |
| Observed Time | Observed UTC time that the action was performed. This reflects the last time there was action on the endpoint that is the last Heartbeat time for the Component. |
| Occurred Time | Time event occurred. |
| Time Local Date | Endpoint local time event occurred. |
Endpoint Catalog Components and Statuses
The component view provides the health status for each endpoint.
Component status is reported through periodic heartbeats. This includes the health status and the control status for each component.
Status is displayed when you hover over the Health column and the icon that displays in the Health column indicates the current status.
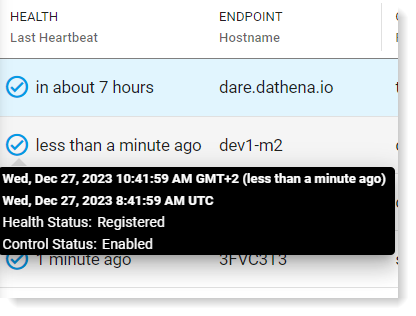
Health Status of the component from the last heartbeat received. This status is received from the Agent.
-
 Registered: Component was successfully installed and does not allow heartbeats
 -
 Unregistered: Component was successfully uninstalled and allows heartbeats
To indicate that the Agent has not contacted the backend, the color display changes:
-
More than 3 days: Orange

-
More than 7 days: Red

Control Status of the component indicates the capabilities depending on if the component is registered/unregistered. This status is managed from the Actions selections in the detail area of the endpoint.
-
Enabled: Allows heartbeats
-
 Disabled: Does not allow heartbeats. This option can be changed when registering a component or manually by an administrator.
 -
 Blocked: Heartbeats are disabled and the component cannot be re-registered even with a re-install.

Viewing Endpoint Catalog Data
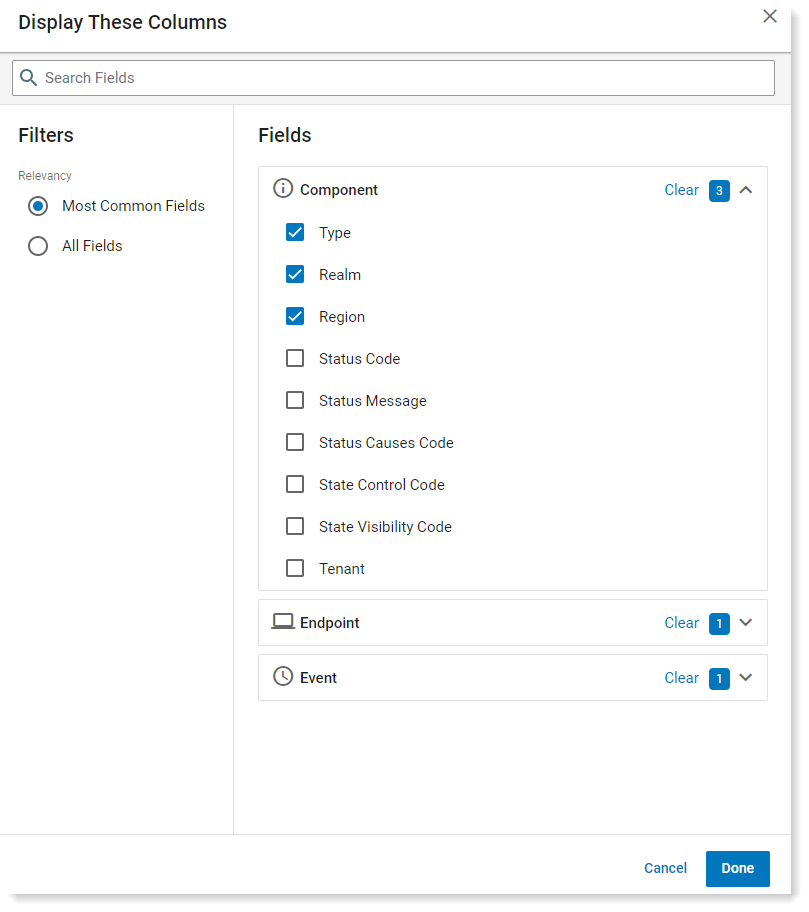
Column Selection
You select the columns you want to display and can filter according to what is relevant for you.
To review and select fields you want to see in the view, click Edit Columns. Select the fields you want to display from the list that displays on the right.
Filters
You can use filters to review the endpoint/component data you want. Filters are displayed at the top of the Endpoint Catalog and you select the filter nodes.
For an example of how to filter endpoints by Agent / Updater only, see Endpoint Catalog Filter by Updater or Agent.
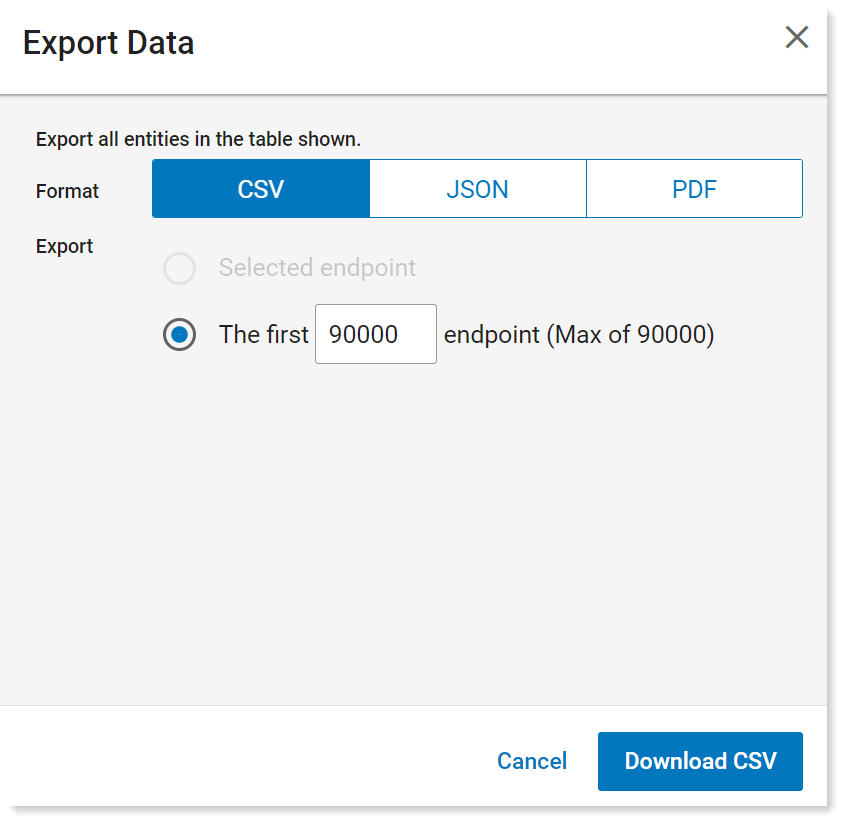
Data Export
You can choose to export the data displayed to CSV, JSON or PDF format. You can download all the endpoints (up to maximum of 90,000 for CSV, 1000 for PDF and 50,000 for JSON), some endpoints or a single endpoint.
By default you can export 20,000 endpoints per tenant. To increase to the maximum 90,000, contact Proofpoint support.
For CSV and PDF, after selecting the columns you want to see, click the arrow![]() next to Edit Columns in the view.
next to Edit Columns in the view.
When you select JSON, not only the selected columns are exported. All columns are exported.
From Export Data, select the format and what you want to export.
Endpoint Catalog Insights
To help you monitor the endpoints and components, Endpoint Catalog includes graphic insights.
The following graphics are currently available in the Insights area:
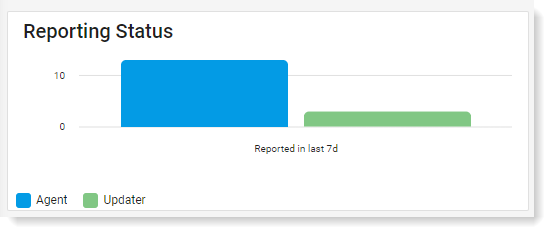
Reporting Status: Shows the number of endpoints by component (Agent and Updater) reporting over the defined time period. (Available from Components and Endpoints views.)
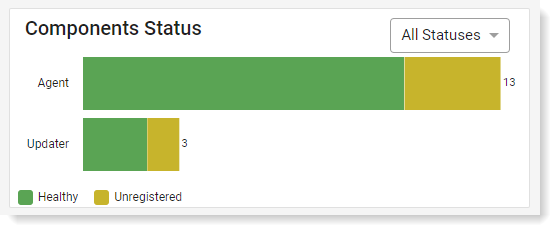
Components Status: Shows the number of components by Healthy, Unregistered, Deleted status. You can select to see components by all statuses or by one of the statuses. (Available from Components and Endpoints views.)
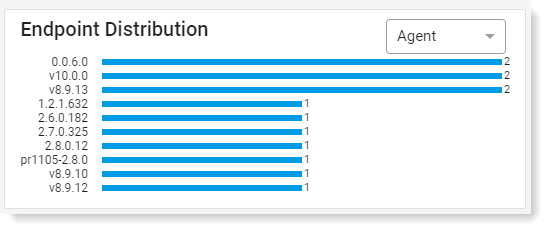
Endpoint Distribution: Shows the number of endpoints by Realm, Agent Version, Update Version and Operating System. (Available from Endpoints only.)
Details
You can view details that provide information about the endpoint, component, software modules, operating system and logs.
From View by Endpoint, click the endpoint you want, and a panel opens on the right with additional details including:
-
Endpoint Composition: Agent version, Bundle version and Updater version
-
Endpoint: Details about the endpoint, including Alias, Hostname, Last Heartbeat, Location IP, Realm, Region and Account. Form here you can all access Data Security Workbench application (Exploration Activities and System Activities and relevant Component data).
-
Operating System: Details about the OS, including Name, Kind and version.
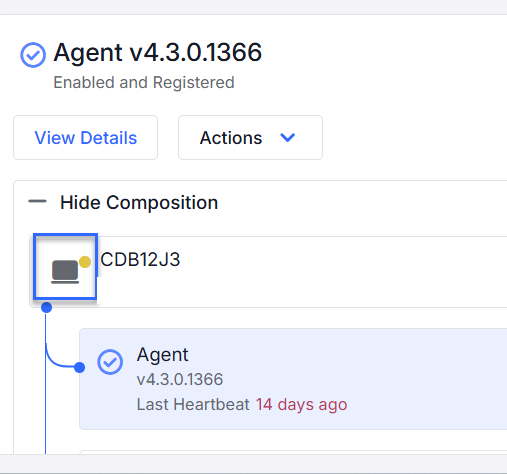
From View by Component, click the component you want, and a panel opens on the right with additional details including:
-
Endpoint Composition: Agent version, Bundle version and Updater version
-
Component Details: Details about the component, including type of component and health status
-
Heartbeats: A detailed diagram of heartbeats
A yellow dot indicates that either Updater or Agent on the same Endpoint is unhealthy.
Actions
You can do the following actions for each component:
-
Disable: The selected component no longer receives updated configurations starting from its next Heartbeat (which occurs every 10 minutes). Within 24 hours, the agent will lose its JWT and will no longer be able to send activity data. Performing a new Registration will cancel the disabled state and re-enable the agent.
-
Block: Like Disable, but with an additional restriction - even Registration attempts are not allowed. The agent remains blocked until an administrator manually sets it back to Enabled.
-
Enable: Cancels the Disabled or Blocked state, allowing the agent to resume normal operation.
-
Hide from Display: A visual-only setting used to filter out certain records from the UI. The agent continues to function normally in the background. A toggle above the UI grid allows hidden agents to be displayed again if needed.
Logs
The Agent writes messages to log files that are stored locally on the endpoint. This information is accessed from the details area by the endpoint.
Related Topic:
Managing Decommissioned Endpoints
< Back Setting Up Endpoint Update Policies
For Advanced Configuration, see ITM / Endpoint DLP Advanced Configuration.