You can monitor endpoints and see the agent distribution and statistics at a glance. Using the filters, you can focus on endpoints you want to monitor.
From this view, you can choose to display details about the endpoint, feed and agent.
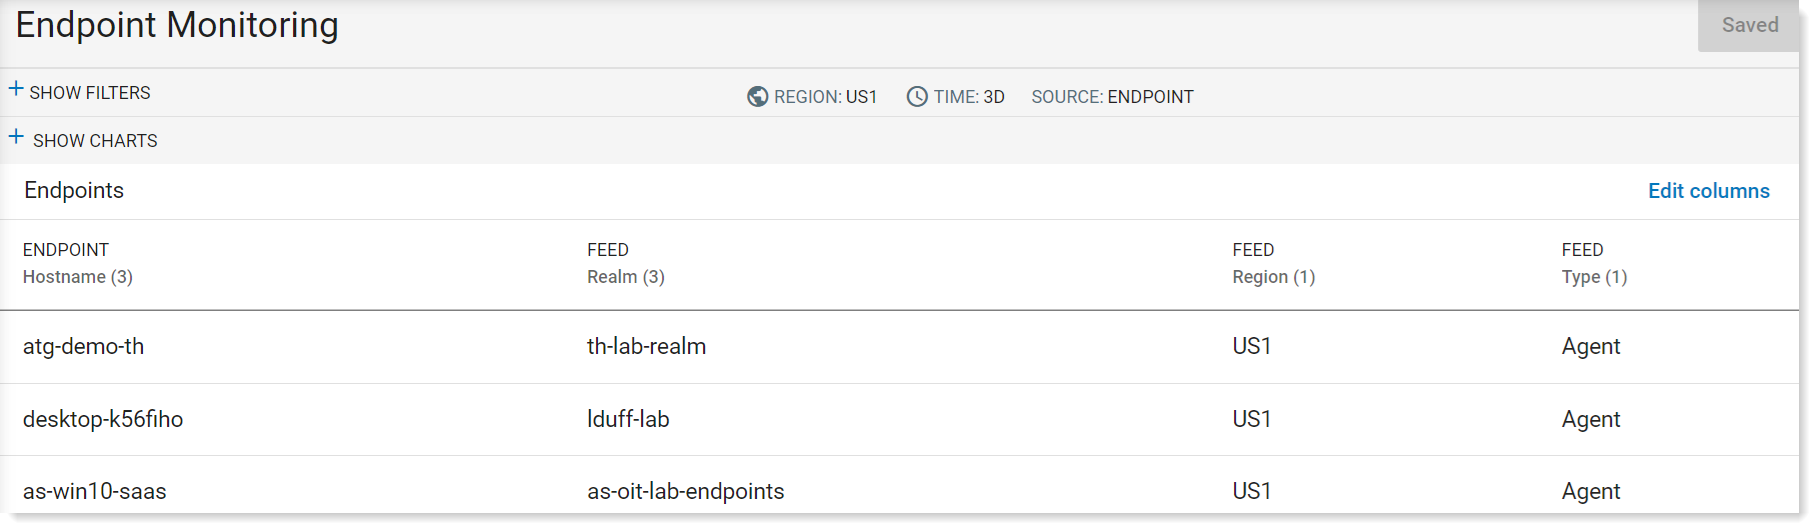
Accessing and Filtering the Endpoint Monitoring View
-
From Proofpoint Data Security, select the Administration app. Select Endpoints > Endpoint Monitoring.
-
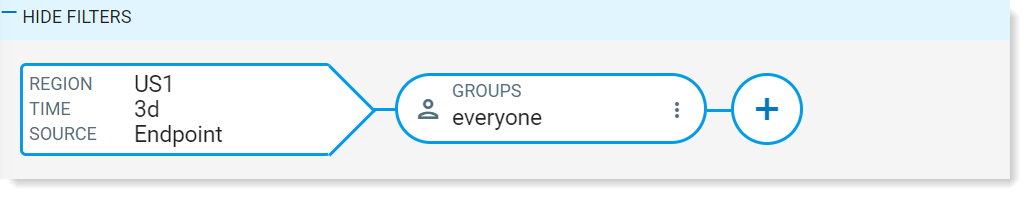
To filter which endpoints you want to see, click Show Filters. In the example, a filter is defined for the group name "everyone" in the US region for 3 days.
Endpoint monitoring includes the following graphical views:
- Statistics: Average and maximum CPU, memory and activities for all or selected endpoints
- Distribution: Agent Realm, version and operating system (windows, mac, linux/unix) distribution for all or selected endpoints
Endpoint Details
For details about an endpoint, click on the endpoint and an additional panel opens to the right with more information about the endpoint.
From this panel you can view:
-
Resources: CPU Activities for the last 24 hours. and Memory usage by day
-
Details: Activities for the last 24 hours. Other details include the Component (Agent or Agent Updater), Agent Realm and Last Heartbeat.
-
Logs: Log Level status and Log Retrieval, see Endpoint Log Files.
Related Topic: