Cloud Apps Dashboard
Overview
The Cloud Apps Dashboard provides you with at-a-glance reports on the overall activities in your connected cloud applications and data governance aspects of files on cloud apps.
Security operations teams can use the dashboard’s filtering capabilities to slice and dice various activities, alerts, cloud files by cloud application and focus on the most relevant alerts and activities first.
This dashboard provides visibility to address various security questions, such as:
-
How many critical alerts were generated in a cloud app(s)?
-
How many files in each cloud app are shared externally or publicly?
-
How many activities involving malicious files on the cloud were performed over the past 7 days across all cloud apps?
-
Who are our top external collaborators?
-
What are the usage trends for each connected cloud app?
The Dashboard is divided into three sections:
-
Overview of Recent Activity - View the overall number of monitored events (including critical alerts), users (internal and external), and recently used cloud files (including malicious). A graph shows the overall activity trend correlated to the number of users over time.
-
Files - Helps you understand various data governance and security aspects of cloud files your organization. View the total number of files according to sharing level, as well as top file types, owners, files matching DLP detectors, external collaborators, and external domains.
-
Instant Messages - Helps you see the top DLP Indicators/Detector that were matched in Instant Messages (Microsoft Teams and Slack).
Dashboard Parameters and Features
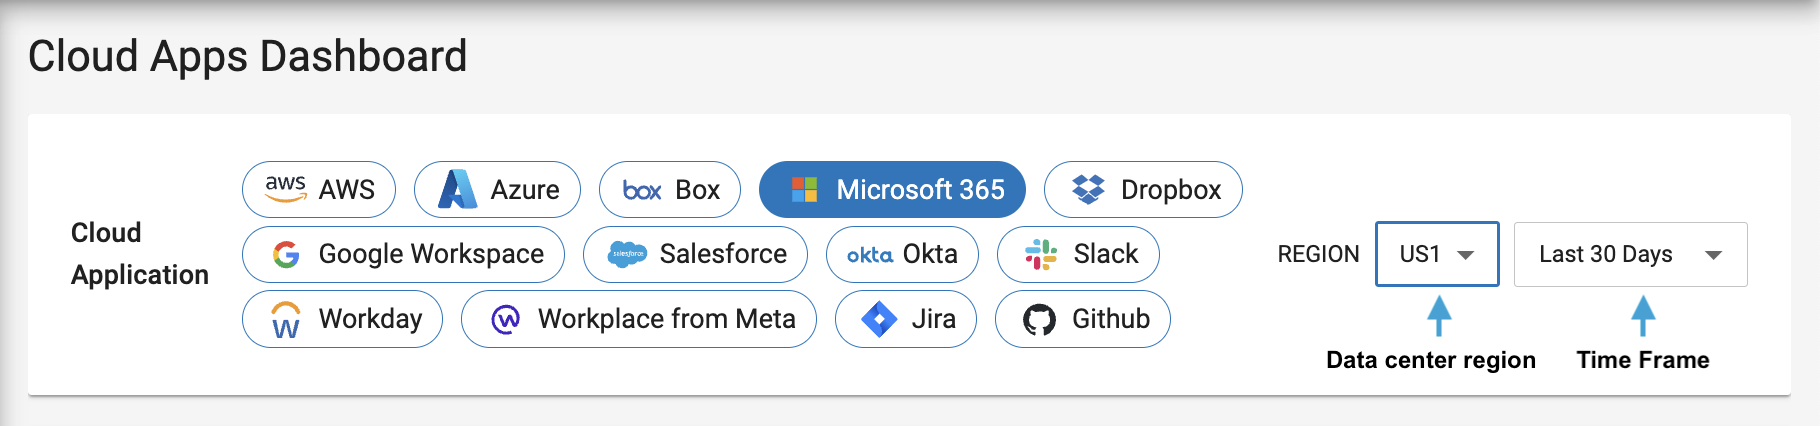
Specify App, Region, and Time
In the report, you specify the cloud apps, data center region, and time range. At the top of the page, you set the parameters you want to see in the different sections.
-
Cloud Application - All connected cloud applications are available for selection. Only data for selected apps (in blue) will display in the dashboard.
-
Region - The following regions are supported: US or UE
-
Time Frame - A selection of time ranges is available.
Next is a detailed look at the sections provided in the report.
Overview of Recent Activity
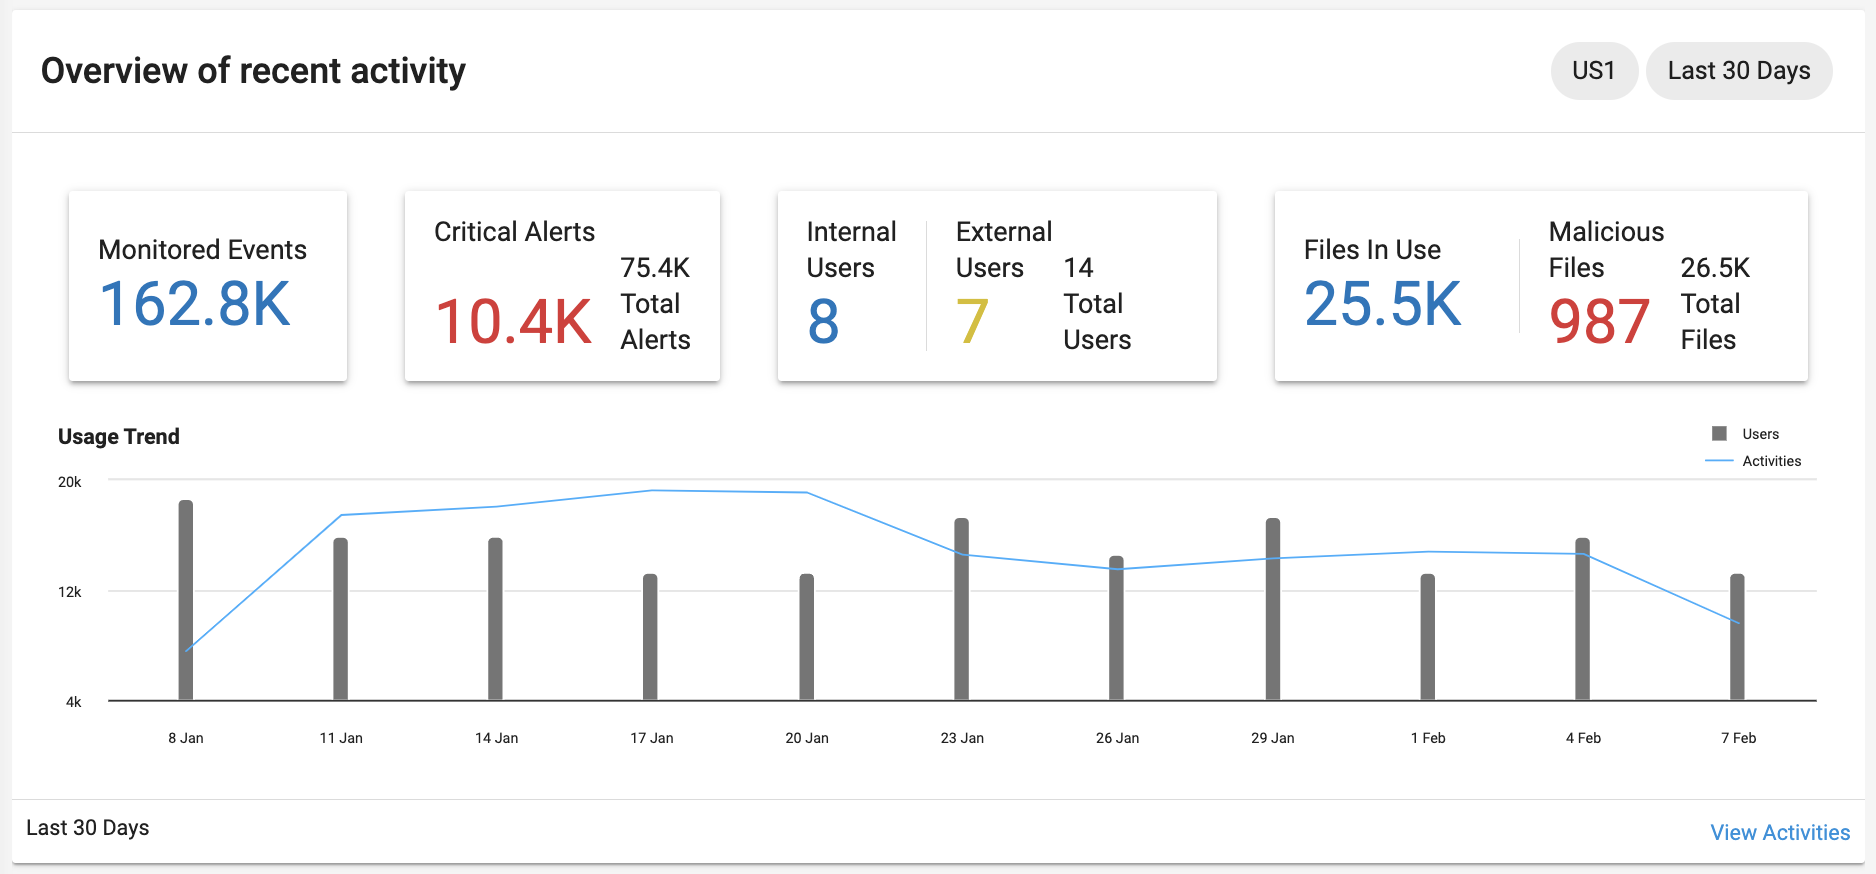
The Overview of recent activity section provides a quick overview of the recent events, users, threats, and files in your organization’s cloud apps.
For the cloud apps, data region, and time frame specified in dashboard parameters, tiles in this section show the total number of:
-
Monitored Cloud Events
-
Critical Cloud Alerts and Total Cloud Alerts
-
Internal Users, External Users, and Total Users - These refer to active users performing one or more cloud activities in the selected time frame, region and app.
-
Files in Use, Malicious Files, and Total Files - Number of files that were involved in file-related activities
Click on any data point shown in a file to open a matching exploration and view the activities. Critical and malicious data will show in red.
Usage Trend
The graph at the bottom of this section helps you answer the question, how many users and activities are we monitoring?
It shows recent information and each point on the chart represents a specific day. By hovering on a date, you can see that day’s total number of:
Users – Total number of monitored cloud users associated with activities.
Activities – Total number of monitored cloud activities.
If the parameters are set for hours (and not days), the chart will show the data points in intervals throughout the day.
Files
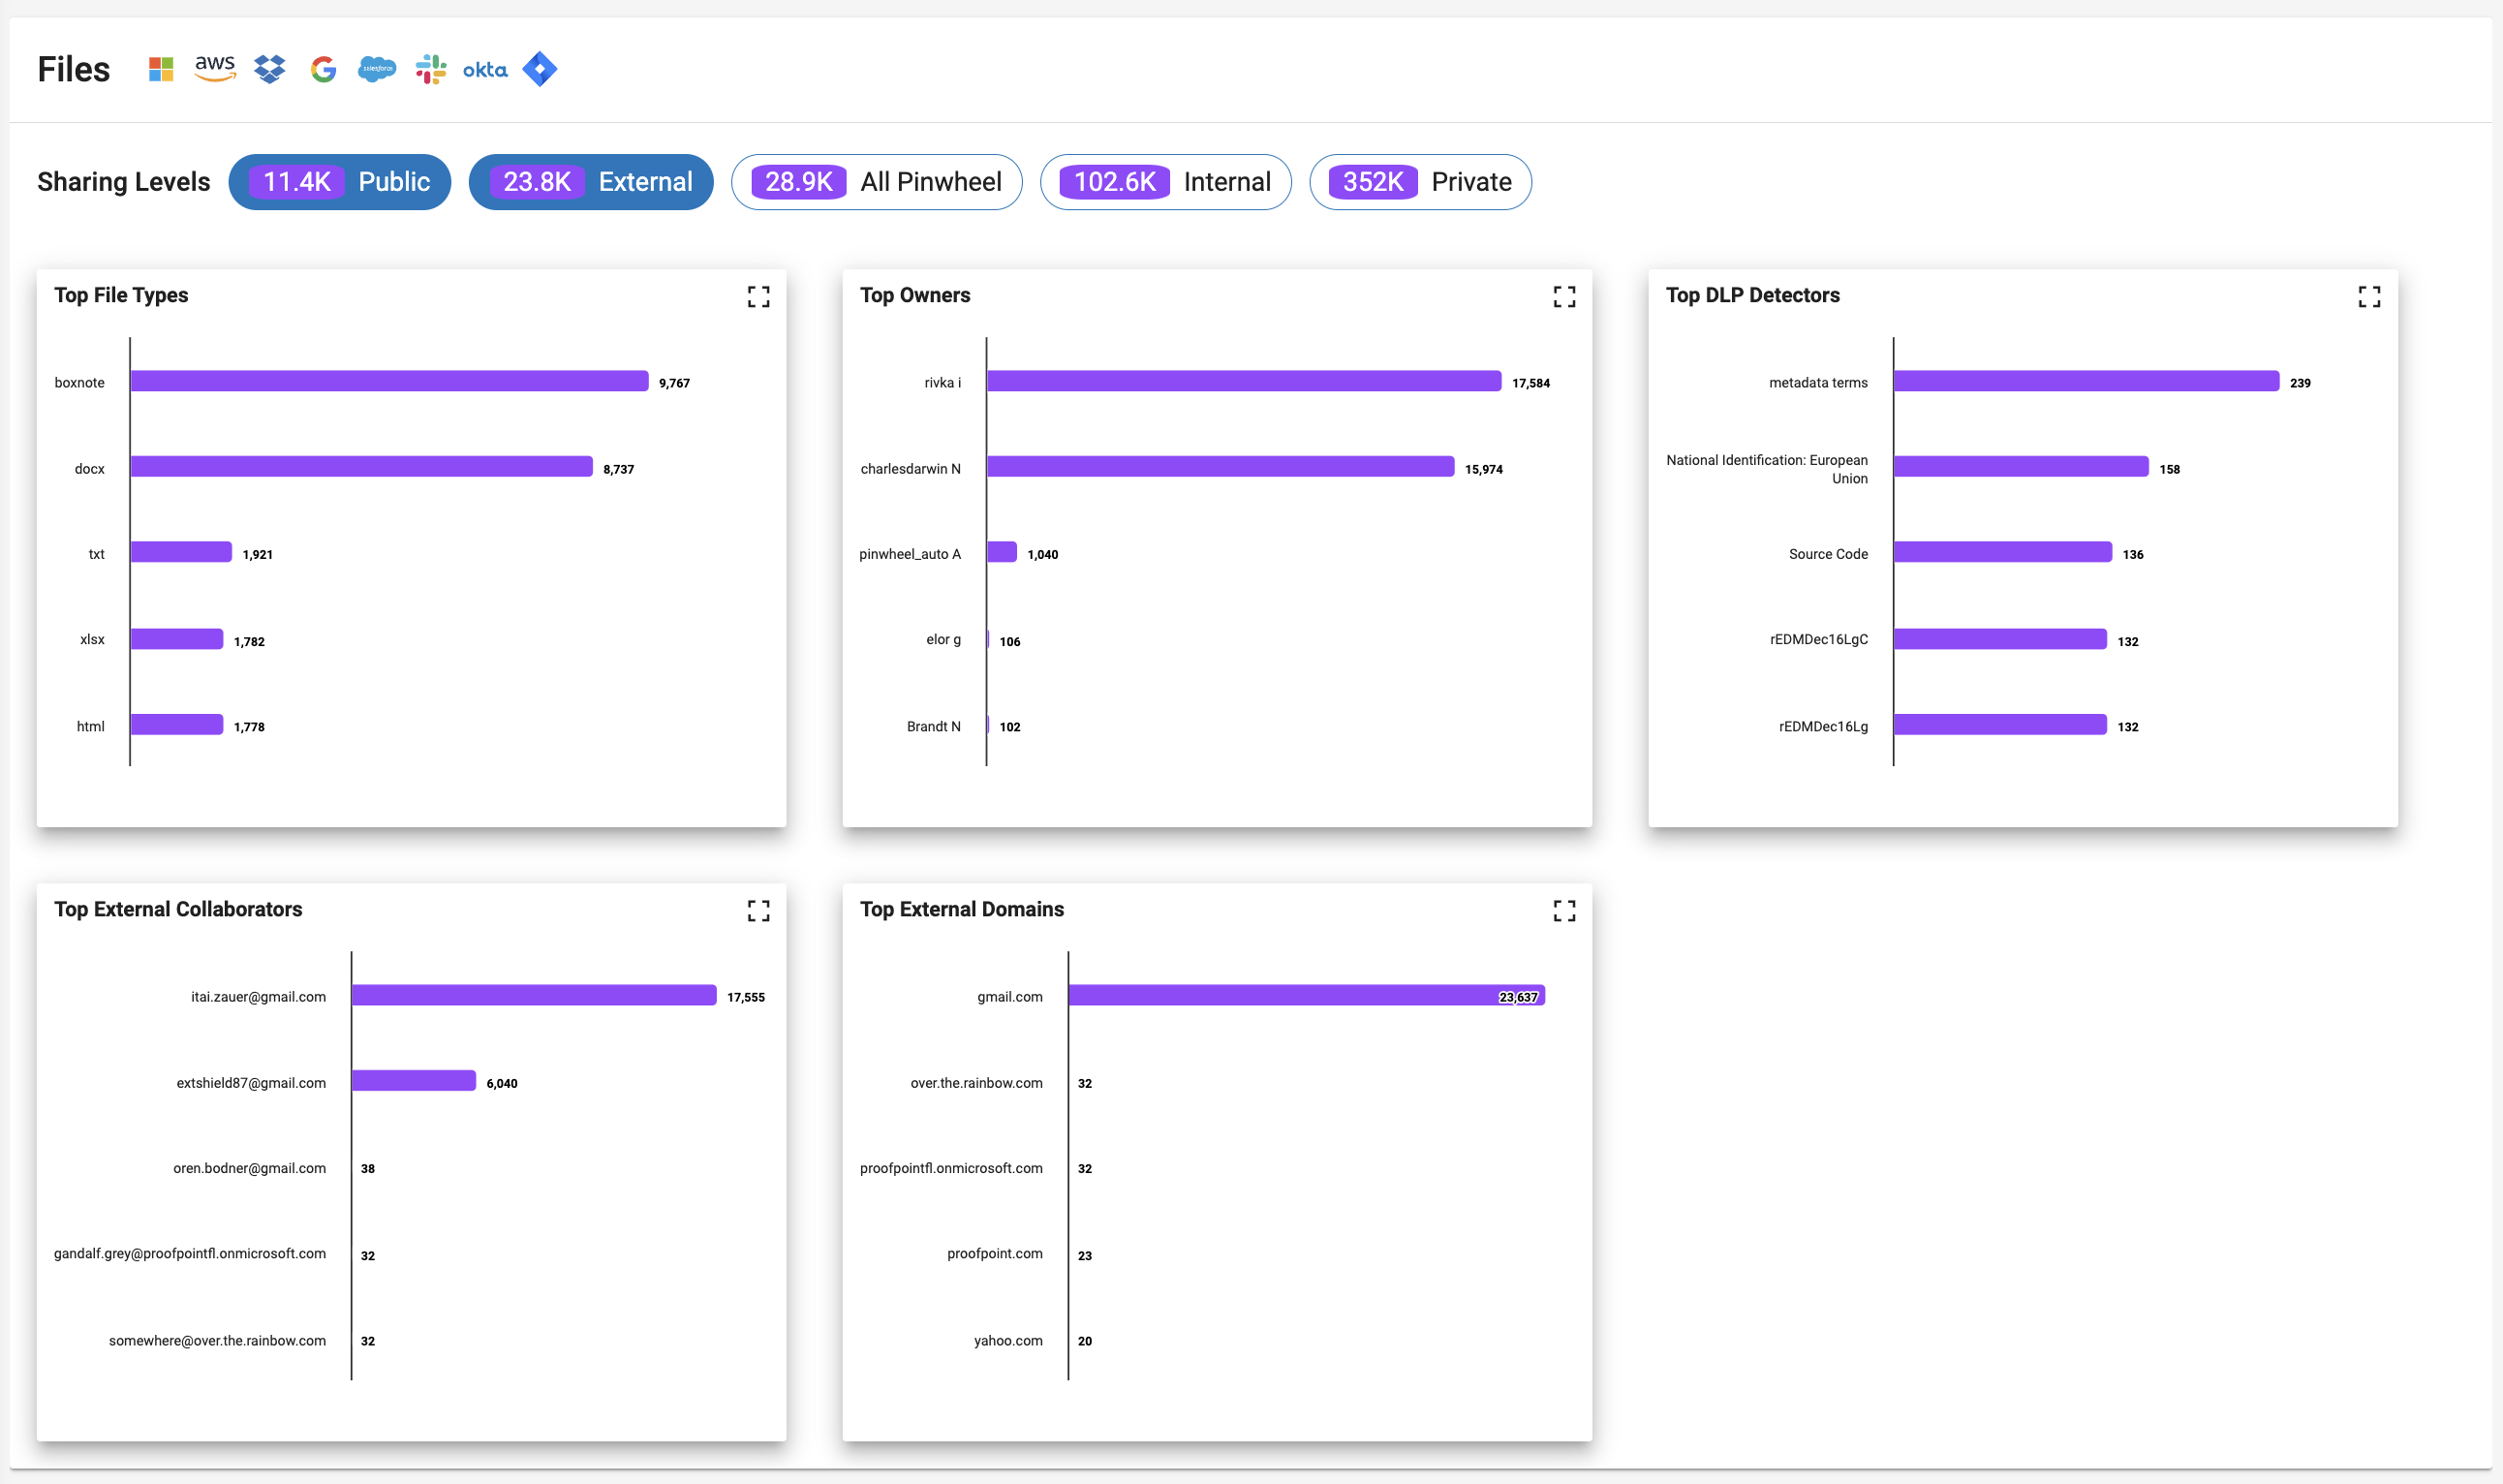
One of the key attributes of a file from a security perspective is sharing - who has ownership and read/write permissions for a file. The sharing attribute of a file provides clear information about file accessibility.
For the cloud apps specified in dashboard parameters, the files section shows file totals according to sharing levels, and file widgets with at-a-glance information for your top questions regarding files. App icons at the top of this section show you the app data currently selected/on view.
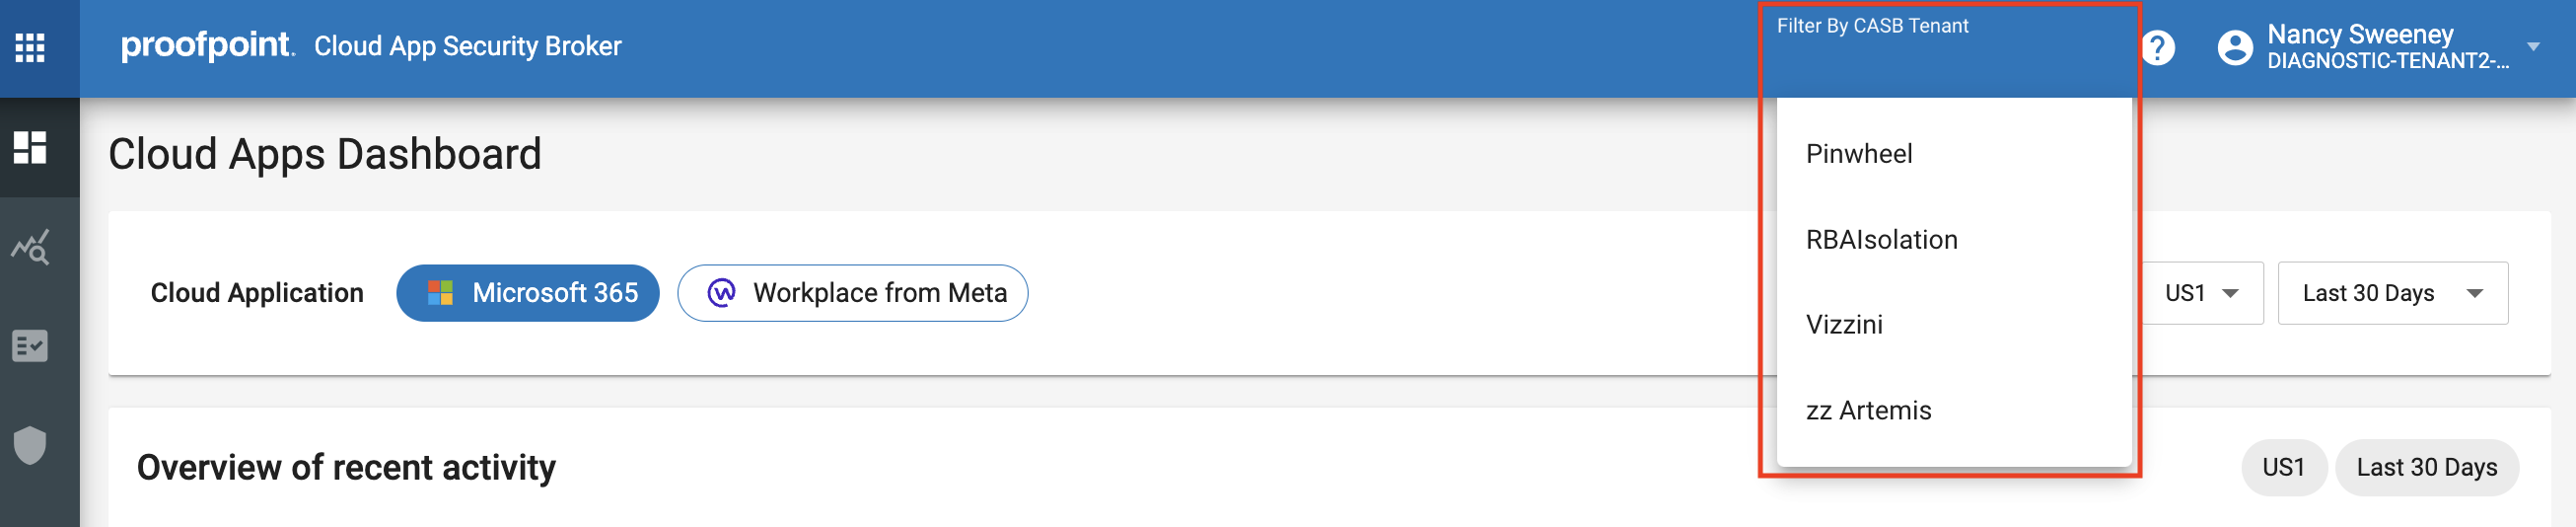
The Files section displays file data for selected apps across your entire organization. This section does not filter by date or region. If you have multiple CASB tenants, this section will show data for the currently selected CASB tenant. To change tenants, use the CASB tenant switcher in the application’s top bar.
Sharing Levels
The pill icons in the top section show the total number of files for each of the following sharing levels:
Public - The file can be accessed by anyone.
External - The file has an external collaborator and is either a) owned by a user in your organization and shared with users outside the organization or b) owned by a user outside of the organization and stored in a cloud app in your organization.
All [name of organization] - The file is shared with all users in your organization.
Internal - The file is shared with one or more users within the organization.
Private - The file is not shared with anyone. Only the owner has read/write permissions.
You can toggle each share level to filter the Files section accordingly. By default, the dashboard shows overly shared cloud files (Public and External share levels).
File Widgets
These file widgets can provide you with better understanding of your organization’s files, what information they contain, and which users are most using files. A separate widget is provided for:
-
Top File Types - Lists the top file extensions used in your organization and total number of files associated with each.
-
Top Owners - Lists the top file owners in your organization and the total number of files associated with each.
-
Top DLP Detectors - Lists the top DLP detectors used to identify sensitive content in your organization’s files and the total number of files associated with each.
-
Top External Collaborators - Lists the top external collaborators (external email addresses unique to your organization) with access to files owned by your organization and the total number of files associated with each.
-
Top External Domains - Lists the top external collaborator domains (external domains unique to your organization) with access to files owned by your organization and the total number of files associated with each.
Click on any value to open an exploration for the users listed on the widget. You can click the expand icon in the upper right section of each widget to view additional results beyond the top five.
Instant Messages
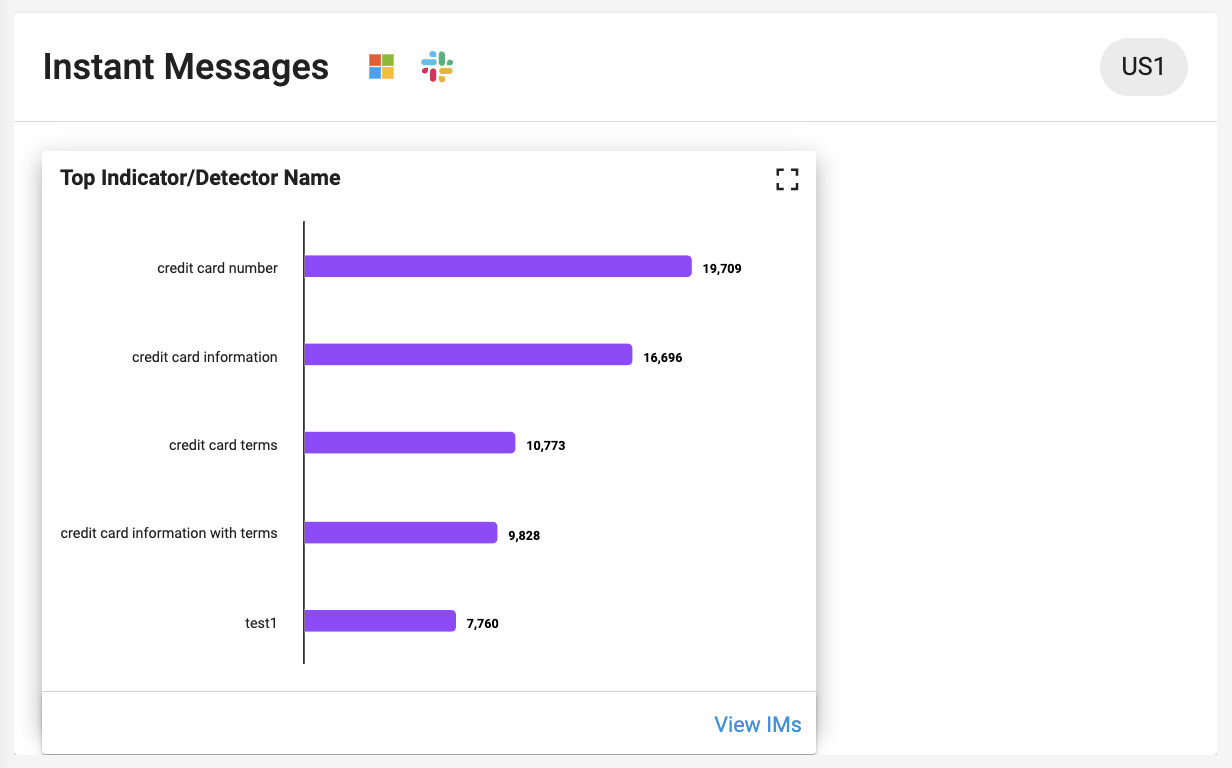
This section helps you understand what types of sensitive data are being shared via your cloud app's instant message features.
For the selected cloud apps and data centers specified in dashboard parameters, this section shows:
Top Indicator/Detector Name - Lists the top indicators/detectors that matched on sensitive content shared via instant messages, and the total number of messages detected for each.
Click on any value to open an exploration for the users listed on the widget.