Visualize paths in your cloud
Understanding the full landscape of your cloud environment helps to uncover how anonymous or malicious actors could exploit entities, resources, or assets that are not securely configured.
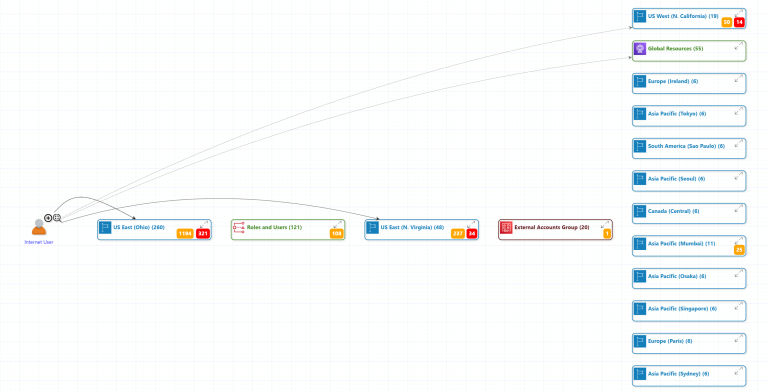
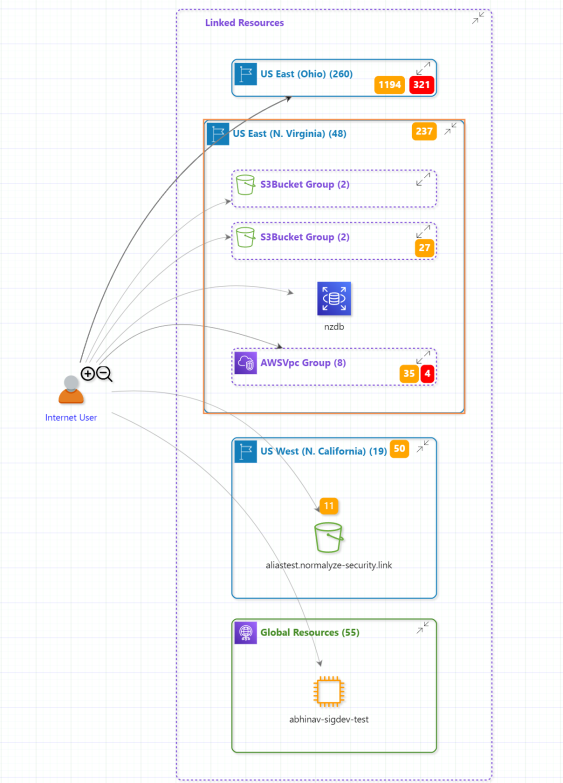
The Infrastructure Graph feature in DSPM provides a visual representation of paths (access means) to reach any resource or asset on a cloud account. This gives Security Operations teams a real-time view of potential paths of attack.
The graph identifies the permissions that one entity has in relation to another and how the entire path from a user or role to the final entity is constructed. This visualizes any potential issue with permissions on the assets, data stores, or entities that could be exploited by any outside entity and cause any form of security or data breach.
For example: The visualization would show how a EC2 instance in a specific region can be reached from any other points / regions / entities from that account or from outside (anonymous access).
Security teams should review this information to ensure the right set of security measures are implemented.
Additional details on the graph include:
- Links for resources, entities from one region of the account to the other regions.
- Links and respective permissions between users and roles extended to the entities which they can access.
- Each of the assets, data stores, resources shows the count of Risks (in Yellow) and Sensitive information (in Red). These items are displayed in detail by selecting the respective resources along with JSON details for it.
- Each of the specific entities can be highlighted as well by selecting the magnifying icon besides them which then would focus only on that specific resource and it’s related links.
The entire visualization can be downloaded in the form of a single page PDF or multi-page PDF from the right hand side options.