What patterns do you see in your risks?
To view the new Dashboard, click your profile icon. In the New UI section, turn on the Dashboards toggle.
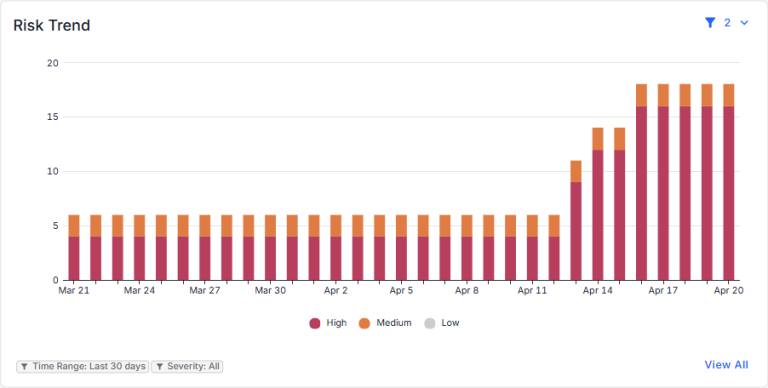
View the patterns that appear in the risks discovered for your data. You can:
- Use the filters in the top-right corner to select the date range and the risk severities to include in the chart. The currently applied filters are shown below the chart.
- The chart shows risks by date. Hover over a bar to view the number of risks for a specific date.
- Click a bar to view the risks for a specific date (on the Open Risks page).
- Click View All to all risks for the date range selected for the chart (on the Open Risks page).