What risks do you need to resolve for each risk category?
To view the new Dashboard, click your profile icon. In the New UI section, turn on the Dashboards toggle.
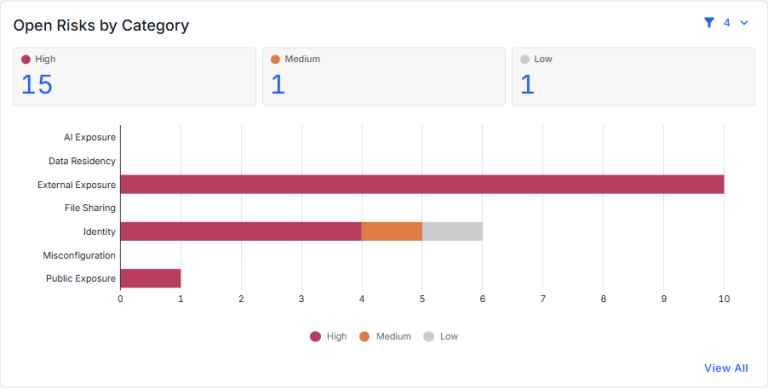
View your open risks by risk category. Each risk category is shown as a bar graph with a breakdown of the high, medium, and low risks in the category. You can:
- Use the filters in the top-right corner to select the data classes, data store type, risk categories, and risk severities to show in the chart. The currently applied filters are shown below the chart.
- Click the High, Medium, or Low risk count (above the chart) to view details for the unresolved risks (on the Open Risks page).
- Hover over a risk category bar to view a count of the high, medium, and low risks in that risk category.
- Click a section of a bar to view details for the high, medium, or low risks in that risk category (on the Open Risks page).
- Click View All to view details for risks in all risk categories (on the Open Risks page).