How old are your risks?
To view the new Dashboard, click your profile icon. In the New UI section, turn on the Dashboards toggle.
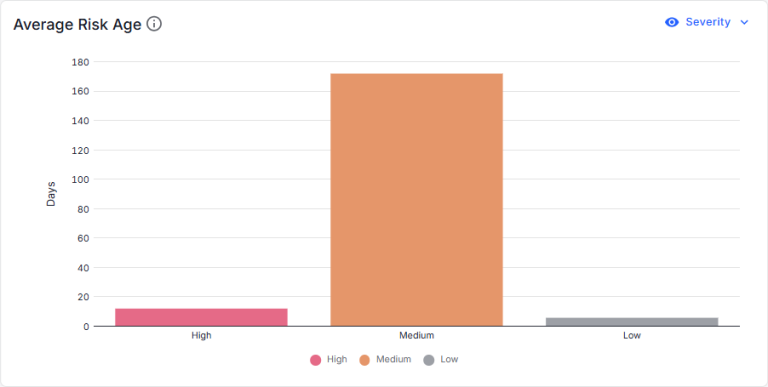
View the elapsed time since a risk was created. The chart shows the average age for high, medium, and low risks. You can:
- Hover over a bar to view the number of risks and their status for that risk severity.
- Click a bar to view details for the open risks for that severity (on the Open Risks page).