How are risk counts trending in your data?
View the trend over the last week of the number risks identified in your data stores.
Select the slider to toggle showing each bar:
- Green bar = Low Risks
- Orange bar = Medium Risks
- Red bar = High Risks
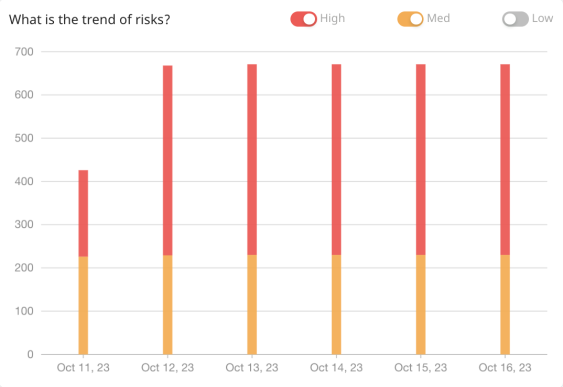
This section can be used as quick review tool to find the overall pattern of risks being detected for cloud accounts and associated data stores.
Mouse over any specific date in this graph to see the count summary for each risk severity.