Timeline
The timeline lets you see all activities in chronological order detailing each action taken in the sequence they were performed. The timeline shows how users access, move and manipulate files and data. This way you can see and understand what happened before and after an alert or a specific user activity and understand the context.
For example, because several alerts were generated for Sally's activity, you want to check what else she has been doing. To see all Sally's activity, access the timeline (see Accessing the Timeline).
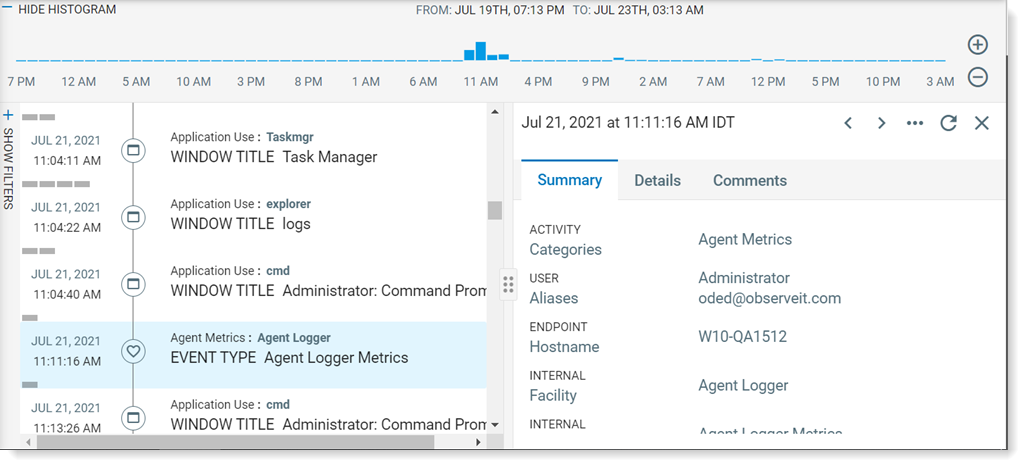
By default, when you open the timeline, you see the list of user activities on the left and summary and details area for the selected user activity on the right. The histogram at the top provides a quick visual view of when user activity occurred. From the left-side, you can select Show Filters where you can filter what you see.
The timeline view includes the following icons to indicate user activity type.
| Icon | Description |
|---|---|
|
|
Application activity |
|
|
Web browsing activity |
|
|
File activity |
|
|
Agent activity |
|
|
USB activity |
|
|
Alert |
Accessing the Timeline
-
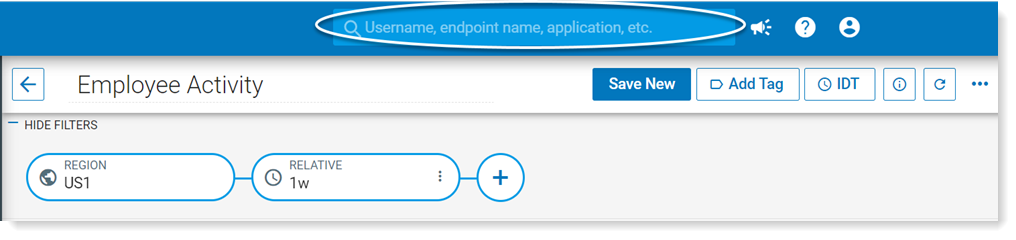
From anywhere in the Data Security Workbench app, you can access and the timeline. Type the username, hostname, endpoint, or system name in the search bar.
-
When the drop down appears, select Go to timeline.
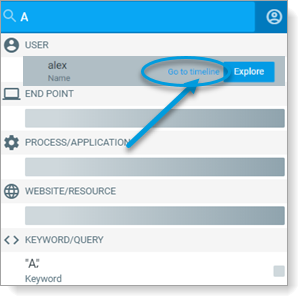
The timeline displays.
-
When the drop down appears, select Go to timeline.
Related Topics: