This topic examines several differences in how the new Data Security WorkbenchExploration works compared to the behavior of the legacy CASB Forensics.
The Exploration page is a single integrated timeline containing both events and alerts, while the activity page in the legacy CASB application displayed only events.
Context Sensitive Lists
The Analytics application provides a list of values for filters based on the context of the most recent query.
For example, if you want to filter by Geo Address Country Name, the list of country names displayed in the filter list is based upon the activity returned by the most recent query.
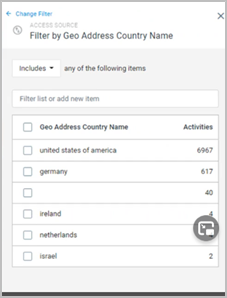
If this list does not contain the country you are looking for, remove the one-week filter to see all the countries that have appeared in the tenant’s activity. Analytics will not list values that have never been seen by this tenant.
Subscriptions
Another change between legacy CASB and Data Security Workbench behavior is subscriptions.
In Data Security Workbench, saved queries have been replaced with explorations. Explorations allow you to create your own query and your own grid results. Rather than having these results pushed to into your mailbox periodically, they are available for you revisit at any time.
Important: Legacy subscriptions will continue to work temporarily but should be migrated to explorations.
For details, see
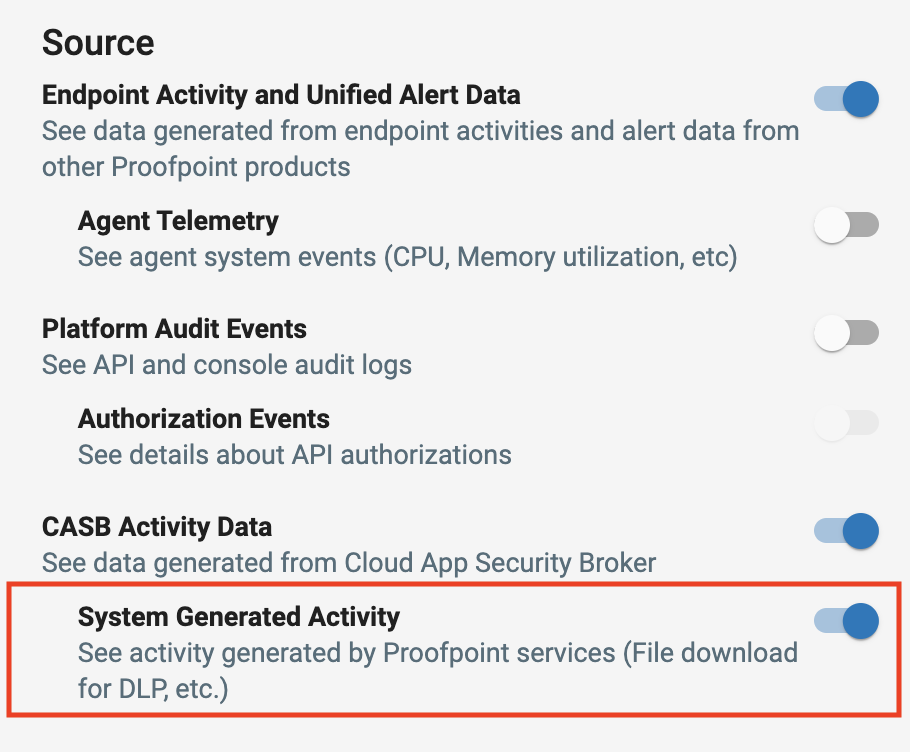
System Events
System events are internal events generated by the CASB application; primarily, file downloads to scan the files for DLP or for malware. By default, system events are not displayed on the exploration page, however, you can configure Analytics to display the system events, also.
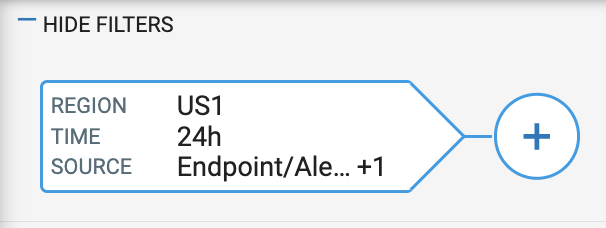
To display system events on the Exploration page:
-
Add a New Exploration.
-
Click on the Source Node
-
Enable System Generated Activity under CASB Activity Data and click Save.

Both internal system events and user events will now appear. System events are labelled 'Internal Event'.