My Dashboard
The dashboard provides you with a quick look at what is happening.
Depending on your organization’s entitlements, you can choose what widgets you want to see.
To access the dashboard, from Data Security, select the Data Security Workbench app. From the left-side-menu, select Dashboard > My Dashboard.
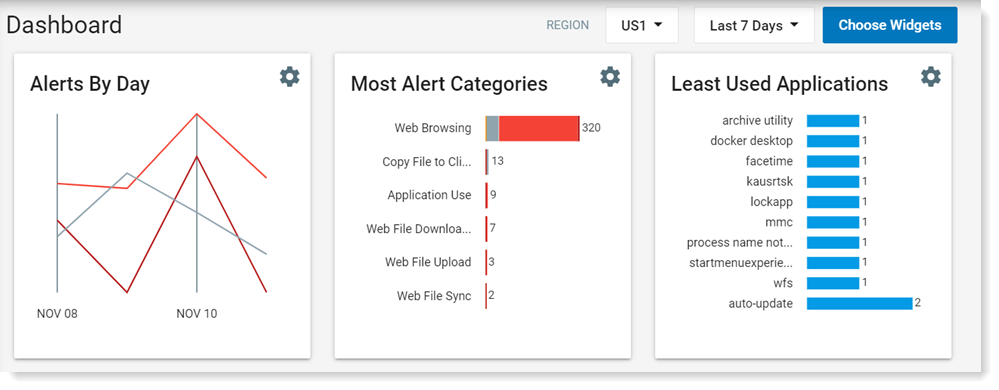
The top of the dashboard displays predefined widgets. You can select which widgets you want to display on the dashboard. Click Select Widgets in the upper-right corner to display the available widgets.
You can select the time range, last 7 days, last 3 days, last 24 hours, last 8 hours, last 1 hour.
You can also select your region.
On any widget, when you click on settings (![]() ), the settings options display.
), the settings options display.
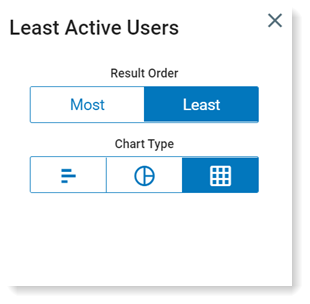
You can:
- choose the chart type, select bar
 , pie
, pie  or table
  .
. - modify the result order, select most or least when applicable
For example:
Here are some of the widgets you can choose from that are relevant for ITM:
- Used Applications
- Used Websites for Browsing
- Used USB Devices
- File Exfiltrations by Destination
- Used Websites for Upload
Here are some of the widgets you can choose from that are relevant for Cloud DLP :
- Events and Alerts by Location
- 3rd Party Apps Activity
- Connected Cloud Services
- Recent Cloud File Activities
Explorations
In the bottom section, you can add graphics showing explorations you have defined. In addition, from the dashboard page, you can go directly to the Explorations page by clicking See all explorations. (See Data Security Workbench - Explorations.)
Time Override
By clicking Set Time Override, you can modify the time for all the Exploration widgets in your Dashboard. For example, you can set a relative time 24 hours and all the widgets will update the last 24 hours. You can also do an absolute range and show activity in all the widgets for a specific date/time.
Related Topics: